
Blog post
Navigation apps send everyone down the same road
Urban algorithmic recommendations and traffic concentration effects.
Navigation apps promise a simple benefit: a better route for each driver. But cities are shared systems. When thousands of people receive similar recommendations at the same time, individual choices can combine into unintended collective outcomes.
Until now, evidence about that outcome has been fragmented. Some studies report shorter journeys and lower emissions; others document congestion, traffic spillovers and pressure on residential streets (see our recent survey paper on the topic). What was missing was a systematic way to test several navigation services, adoption levels and traffic conditions across different cities.
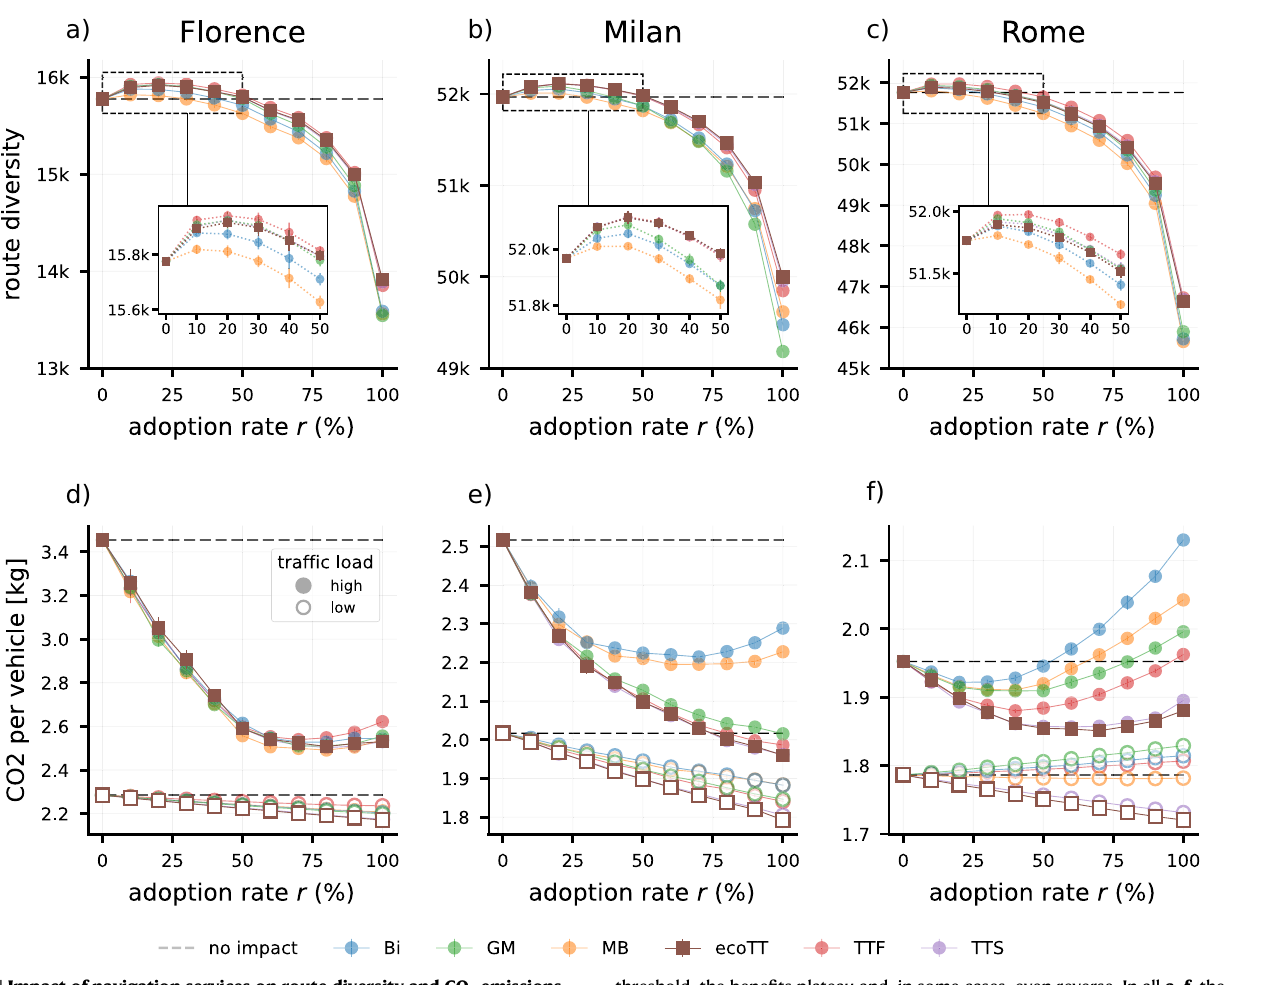
Our study shows that navigation services produce a consistent traffic concentration effect. As more drivers follow algorithmic recommendations, routes converge onto a smaller part of the road network. At low adoption, this can reduce emissions. At high adoption, however, the benefit reaches a plateau and may disappear or reverse because too many vehicles are directed towards the same roads.
The problem
Navigation platforms such as Google Maps, Bing Maps, Mapbox and TomTom optimise routes one request at a time. Each recommendation may be efficient for the driver receiving it, but the platform’s collective impact depends on what happens when many drivers act on similar advice.
This is a coordination problem. If recommended routes overlap, traffic becomes concentrated. Roads that initially look efficient can become congested as adoption grows, changing speeds, queues, fuel consumption and emissions. The best route for one driver is therefore not necessarily part of the best allocation for the city as a whole.
Previous findings have been difficult to reconcile because studies often examine a single provider, one city or one level of adoption. Real-world experiments are also difficult: traffic conditions cannot be reset, non-users still interact with users, and accidents, roadworks and changes in demand make exact replication impossible. A common framework is needed to compare counterfactual scenarios, e.g., what the same morning traffic might look like if 20%, 60% or 100% of drivers followed a navigation service.
What we studied
We built a simulation framework for Florence, Milan and Rome, three cities with different sizes and road-network structures. The framework combines road maps from OpenStreetMap, mobility demand inferred from a year of vehicle GPS traces, and routes returned by six navigation profiles: Bing Maps, Google Maps, Mapbox, TomTom Fastest, TomTom Shortest and TomTom Eco-routing.
Traffic was simulated with SUMO, an open-source microscopic traffic simulator that represents individual vehicles, junctions, queues, speeds and acceleration. For every service, we varied the share of drivers following its recommendations from 0% to 100% in ten-percentage-point steps. The remaining drivers followed plausible alternatives to the fastest route, representing imperfect knowledge, personal preferences and variation in human route choice. Each scenario was repeated ten times with different assignments of drivers to the two groups.
We evaluated two outcomes. Route diversity is the number of distinct road segments used by at least one vehicle: lower diversity means that traffic is concentrated on fewer roads. CO2 emissions were estimated from each vehicle’s speed and acceleration. We tested both low-traffic conditions and traffic approaching congestion, and then repeated the experiment on synthetic grid networks to determine whether the observed pattern depended on the particular geography of the three cities.
What we found
The clearest result is that widespread adoption makes routes more alike. At low-to-moderate adoption, route diversity initially rose slightly: by at most 1.05% in Florence, 0.34% in Milan and 0.41% in Rome. Once adoption passed a city- and service-specific threshold of roughly 25–50%, the pattern changed. At full adoption, route diversity was 11.80–14.34% lower in Florence, 3.79–6.87% lower in Milan and 9.73–14.26% lower in Rome than in the no-adoption baseline.
Emissions depended on both traffic load and adoption. Under low traffic, navigation was generally beneficial. At full adoption, estimated CO2 emissions fell by 2.15–5% in Florence and 6.64–11.13% in Milan. Rome was more mixed: some services reduced emissions by 0.26–3.69%, while Google Maps, TomTom Fastest and Bing Maps increased them by 2.40%, 1.13% and 1.57%, respectively.
Under heavy traffic, the relationship became nonlinear. Early increases in adoption often produced substantial CO2 reductions, but the marginal benefit diminished as routes converged. In Florence, the largest reduction occurred around 70–80% adoption and then weakened. In Milan, Google Maps and the TomTom profiles still reduced emissions by 19–22% at full adoption, whereas Mapbox and Bing Maps peaked at about a 12% reduction around 60–70% adoption and ended at roughly 9%. In Rome, the best adoption rate varied from 20% to 70% depending on the service. Beyond their respective thresholds, four services produced more CO2 than the no-navigation baseline—up to 9.10% more for Bing Maps.
Navigation apps can improve individual journeys while making the city’s traffic collectively more concentrated.
The spatial distribution changed as well. High-capacity roads made up only about 6% of the networks studied, yet their share of CO2 emissions rose from 17.61% to 36.25% in Florence, from 9.94% to 26.42% in Milan, and from 26.02% to 33.66% in Rome as adoption moved from zero to 100%. Compared with 50% adoption, full adoption shifted an additional 2.04% of Florence’s total emissions, 2.31% of Milan’s and 3.90% of Rome’s onto the most polluted 20% of road segments.
Route diversity and emissions were strongly linked under heavy traffic: the Spearman correlation between their marginal changes ranged from -0.882 to -0.958 across the three cities. The synthetic-network experiments helped clarify the mechanism. With only one flow of vehicles, concentration did not eliminate the emissions benefit. With two flows crossing at shared intersections, the real-city pattern reappeared: falling route diversity, emissions that first declined and then plateaued, and a more unequal spatial distribution of emissions. This supports the interpretation that the effect emerges from interactions among algorithmically aligned routes, not simply from a city’s particular street layout.
Why it matters
For city governments, the results suggest that navigation services should be assessed as part of the transport system rather than only as consumer tools. A platform may improve the route offered to an individual while redistributing congestion, noise and pollution across neighbourhoods. Areas beside highways and major arterial roads may bear a disproportionate share of these externalities, raising questions of environmental justice as well as network efficiency.
For navigation providers, the study exposes a limit of individual optimisation. Even TomTom’s eco-routing profile followed the same qualitative pattern: when many users are sent along similar “eco-optimal” routes, congestion can erode the environmental advantage. A more effective objective would account for the distribution of all recommended routes, preserve enough route diversity and coordinate users at the system level.
For policymakers, the framework offers a way to test counterfactuals before intervening. Cities could examine whether recommendations increase traffic near schools, hospitals or already burdened neighbourhoods; evaluate proposed access restrictions; and ask platforms to mitigate or compensate for measurable harms. This logic is consistent with the broader emphasis on identifying and reducing systemic platform risks in the EU’s Digital Services Act.
The findings should not be read as exact predictions for every city. They come from simulations of morning travel in three Italian cities, using GPS-derived demand with 2–5% market penetration and route recommendations based on typical rather than real-time traffic. The emissions model represents a gasoline-powered Euro 4 passenger car, and the experiment does not model a continuous feedback loop in which platforms and drivers repeatedly adapt to one another. Because treated and untreated vehicles share the same roads, spillovers between them also make the estimated effects conservative. Simulations cannot replace on-road measurements, but they make controlled comparisons possible at a scale that field experiments currently cannot.
What comes next
The central design challenge is to build navigation systems that improve journeys without collapsing route diversity. That means moving beyond the fastest or greenest route for each isolated request and developing strategies that account for congestion, emissions and exposure across the city as a whole.
Several questions remain open. How would the concentration effect evolve when recommendations respond dynamically to the traffic they helped create? Can platforms coordinate or randomise routes without making travel substantially slower? How should benefits and harms be distributed across neighbourhoods? And which information or auditing access do cities need in order to evaluate proprietary routing systems?
The same framework can also be extended to other outcomes, including traffic safety, noise, neighbourhood segregation, ride-hailing and car-sharing. More broadly, navigation is a concrete example of human–AI coevolution: human behaviour trains and informs algorithms, algorithmic advice changes behaviour, and the resulting city becomes the input for the next round of recommendations.